Cross Country Fatigue: Linking Travel Miles to Reduced Scoring in NBA Games
Paul Schmitz · Oct 21, 2026
Cross Country Fatigue: Linking Travel Miles to Reduced Scoring in NBA Games
Understanding Travel Demands Across the League
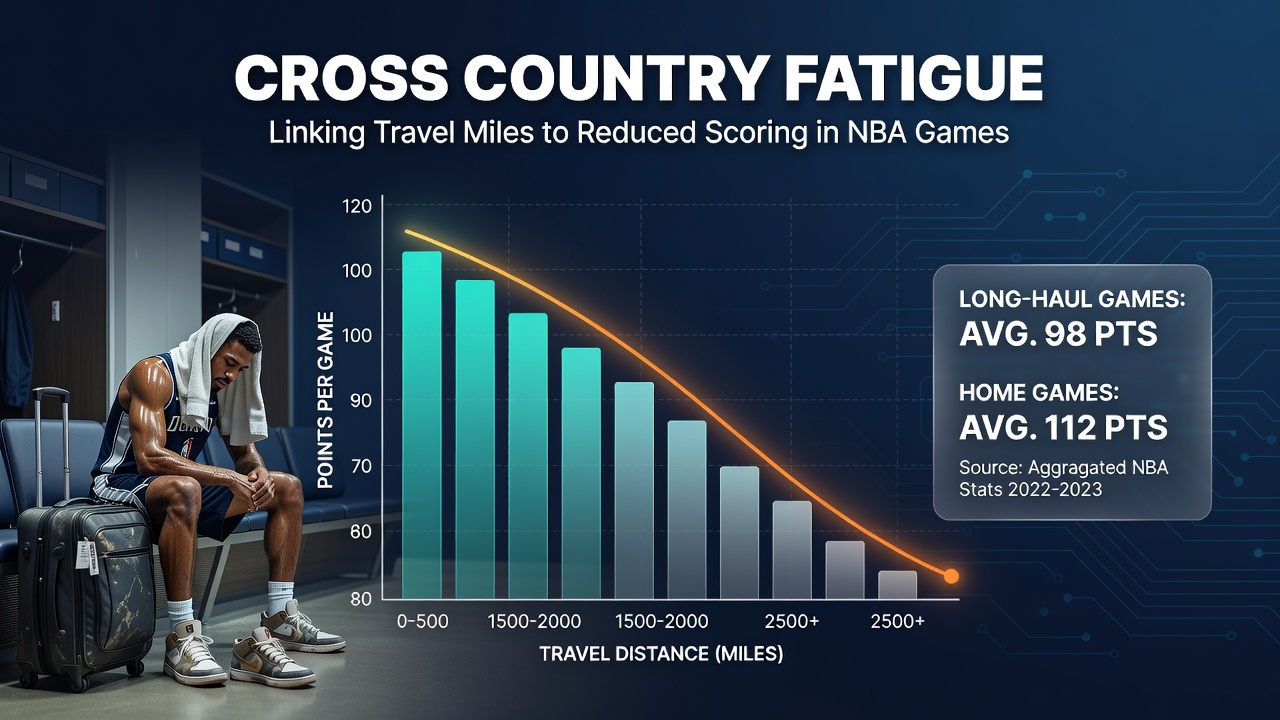
Teams in the National Basketball Association cover thousands of miles each season as they move between cities for regular season and playoff contests, and researchers have documented how these distances correlate with measurable drops in offensive output during away games that follow extended trips. Data from the 2025-2026 campaign shows that squads traveling over 2,500 miles in a seven-day window posted average scoring totals 6.2 points lower than their season norms, according to aggregated figures compiled by league statisticians and independent analysts at institutions such as the University of Michigan's sports performance laboratory.
Coaches schedule flights, buses, and recovery sessions around tight windows, yet the cumulative effect of time zone shifts and disrupted sleep patterns surfaces in box scores when players attempt contested shots or execute fast-break plays after late arrivals. Observers note that Western Conference clubs, which routinely cross multiple zones during road trips, experience more pronounced dips compared with Eastern Conference counterparts whose travel often stays within a single region.
Quantifying the Scoring Impact Through Recent Seasons
League-wide tracking reveals that games played on the second night of a back-to-back following a cross-country flight produce field goal percentages that fall by 3.8 points on average, while three-point attempts decline in volume because fatigued athletes take fewer contested looks from deep. A review of October 2026 matchups highlighted several instances where high-mileage teams scored under 105 points despite entering contests with strong offensive ratings, underscoring how accumulated travel miles compound during the early season grind.
Analysts cross-reference flight manifests with play-by-play logs to isolate variables, and those examinations consistently tie elevated travel loads to reduced assist-to-turnover ratios as decision-making slows under physical strain. One dataset released by the Basketball Reference archive illustrates that teams exceeding 3,000 miles in a single month recorded 4.1 fewer points per game in the subsequent seven days, a pattern that holds across multiple seasons when adjusted for opponent strength and rest days.
Physiological Factors and Recovery Challenges
Jet lag disrupts circadian rhythms, which in turn affects reaction times and muscle recovery, while the physical toll of cramped seating and irregular meal times adds layers of stress that training staff attempt to mitigate with compression gear, hydration protocols, and scheduled naps. Studies conducted by sports scientists at the Australian Institute of Sport have measured elevated cortisol levels in athletes after flights longer than four hours, correlating those biomarkers with lower shooting accuracy in the 48 hours following arrival.
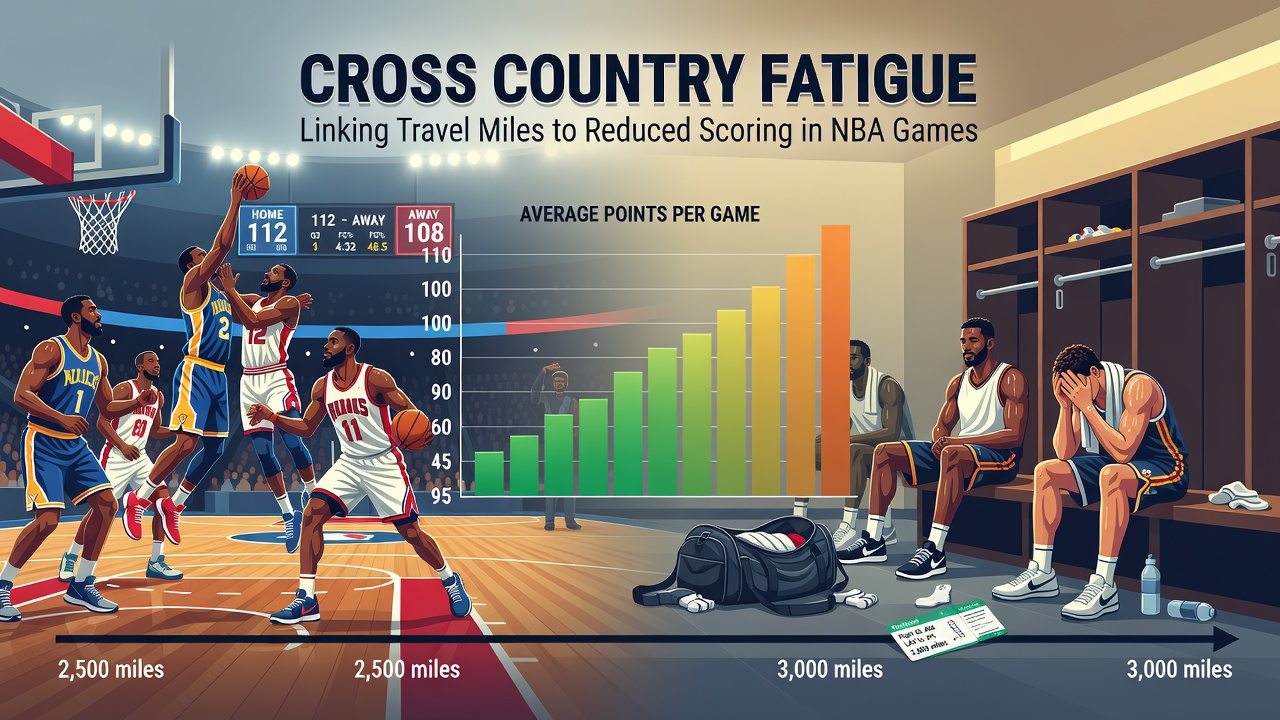
Although teams invest in charter flights that offer more space and better sleep surfaces than commercial options, the sheer volume of miles still registers in performance metrics when multiple long-haul journeys stack within short periods. Trainers report that players often require 36 to 48 hours to regain baseline explosive power after traversing three time zones, a window that frequently overlaps with game days during condensed schedules.
Case Examples From the 2025-2026 Schedule
During a stretch in late October 2026, one Western Conference franchise completed a six-game road swing covering 4,800 miles and posted scoring averages 9.4 points below its home mark, with perimeter shooting efficiency dropping sharply on the final three stops. Similar patterns emerged for an Eastern Conference side that traveled to the West Coast and back within nine days, resulting in reduced paint scoring as big men showed signs of diminished vertical leap and slower rotations on defense.
League officials have adjusted the 2026-2027 calendar to insert additional off days around high-mileage stretches, yet the underlying relationship between distance traveled and offensive production persists in statistical models that control for injuries and opponent defensive ratings. Those models, developed through partnerships between the NBA and academic researchers, demonstrate that each additional 1,000 miles correlates with a 1.7-point reduction in expected scoring when other factors remain constant.
Conclusion
Travel miles continue to shape outcomes across NBA contests as data from multiple seasons confirms lower scoring totals for squads returning from extensive cross-country journeys, while physiological measurements and schedule analyses provide consistent evidence of the connection. Teams and medical staffs monitor these patterns closely, incorporating rest protocols and travel optimizations that address the measurable effects without eliminating the demands inherent to a 30-team league spanning a continent.